During the second half of the 19th century the United States experienced a tremendous surge of immigration from Europe, dramatically increasing the populations of American cities. The Second Industrial Revolution and the explosive growth of railroad construction also contributed to the rapid growth of the nation’s urban areas.
The rapid development of American cities prompted Daniel Alfred Sanborn in 1866 to begin creating detailed maps of these cities for use by American insurance companies. The maps provided precise information about each structure within the city limits. This information included the exact dimensions of each building, locations of doorways and windows, the composition of the materials used to construct the building (wood or brick), the proximity of fire hydrants as well as the capabilities of the local fire department.
During the final decades of the 19th century and the first half of the 20th century, the Sanborn Map Company created highly detailed maps of 12,000 cities and towns across the United States. These maps provided insurance underwriters with a reliable resource for determining the potential fire risks. They utilized the information supplied by these maps to underwrite fire insurance policies.
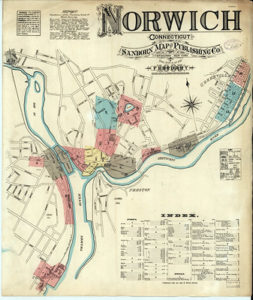
The Sanborn Map Company went out of existence in the early 1960’s. Their archive of urban maps is now a resource for historical research by preservationists, urban planners and genealogists. To view the six Sanborn maps (1885-1914) created for the city of Norwich visit the Otis library’s Flickr page and click on the link for historical photographs.